Analysis of Macroeconomic Operation in 2018 and Prospect in 2019

I. Macroeconomic performance
(1) Gross domestic product
1. The macroeconomic boom is declining, and the economic growth rate is slowing down quarter by quarter. Since 2018, China’s macroeconomic growth rate has continued to decline slightly, basically in the downward stage of the boom cycle, which is basically consistent with the global economic operation.
According to preliminary accounting, the gross domestic product (GDP) in 2018 totaled 90.0 trillion yuan, and the nominal GDP increased by 9.7% year-on-year, down 0.7 percentage points from 2017; The real GDP increased by 6.6% year-on-year, and the actual growth rate decreased by 0.2[1] and 0.1 percentage points respectively compared with 2017 and the first three quarters, and it declined quarter by quarter. Among them, the year-on-year real GDP growth rate in the fourth quarter [2] dropped to 6.4% (Figure 1-1), which was the same as that in the first quarter of 2009, and the lowest since the data was recorded (1992). It should be noted that the economic growth in 2018 is still in a stable range, which has not deviated from the target range of "around 6.5%" set at the beginning of the year, nor has it brought obvious pressure on employment.
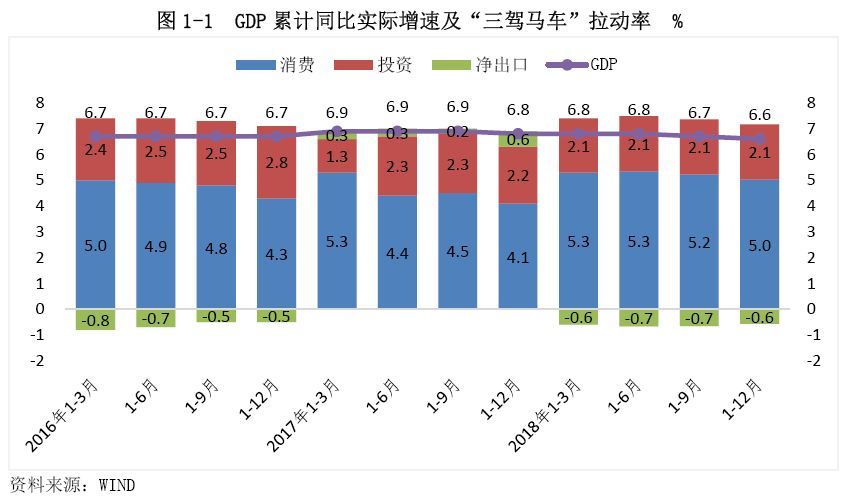
2. The basic role of consumption has been enhanced, investment has weakened year-on-year, and net exports have returned to a negative pull on economic growth. In terms of troika, in 2018, consumption drove GDP growth by 5.0 percentage points, 0.9 percentage points higher than that in 2017. In the context of the continuous decline of zero social growth rate during the year, service consumption maintained rapid growth, which further enhanced the basic role of consumption in economic growth. In 2018, the growth rate of infrastructure investment slowed down sharply, which led to the weakening of the contribution of investment to economic growth, driving GDP growth by 2.1 percentage points, down 0.1 percentage points from 2017. Due to the sharp narrowing of the trade surplus in goods, the trade deficit in services has significantly expanded, and net exports have declined year-on-year. In 2018, net exports lowered the GDP growth rate by 0.6 percentage points, while in 2017, it was positively pulled by 0.6 percentage points. Therefore, from the perspective of total demand, the slowdown in GDP growth in 2018 is mainly due to the negative impact of net exports and the decline in investment contribution, while consumption has become a ballast stone to stabilize the macro economy.
(II) Three industries and their operation conditions
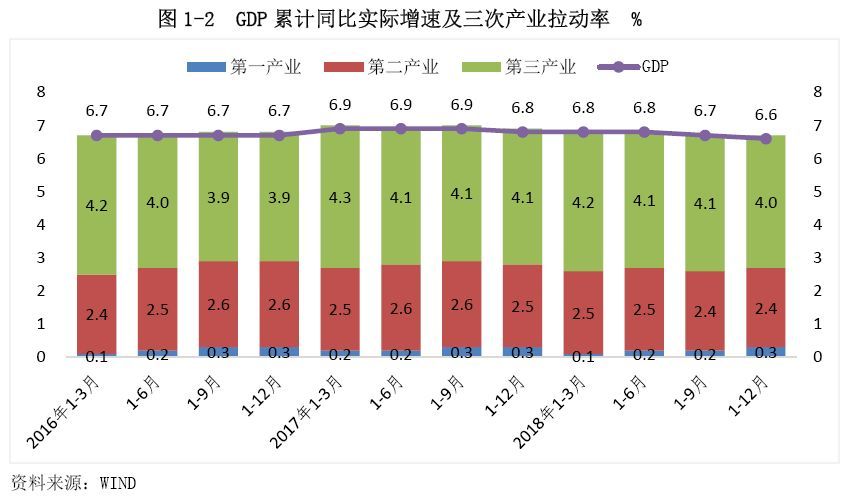
1. The growth rate of the three industries generally declined, and the leading role of the service industry was stable. In terms of three industries, the added value of the tertiary industry increased by 7.6% year-on-year in 2018, which was 0.3 percentage points lower than that in 2017, but still faster than the GDP growth rate by 1 percentage point in the same period, indicating that the service industry continued to play a leading role in the macro-economy. The added value of the secondary industry increased by 5.8% year-on-year, and the growth rate was 0.1 percentage point lower than that of 2017 and 0.8 percentage point lower than that of GDP in the same period. The main reason is that China is now in the late stage of industrialization, and the share of industry in the national economy has declined. The added value of the primary industry increased by 3.5% year-on-year, and the growth rate dropped by 0.5 percentage points compared with 2017. In 2018, the growth rate of the three industries generally declined, which was basically in sync with the slowdown in GDP growth (Figure 1-2), indicating that the weakening of the demand side was positively transmitted to the production side and had a wide impact.
From the perspective of contribution rate and pull rate, in 2018, the service industry played a stable leading role in economic growth, with its contribution rate to GDP growth of 60.1% and pull rate of 4.0 percentage points, both higher than that of the secondary industry [3], but 1.3 and 0.1 percentage points lower than that of 2017, which is confirmed by the slowdown of service industry production growth. In 2018, the national service industry production index increased by 7.7% year-on-year, and the growth rate decreased slightly by 0.5 percentage points compared with 2017.
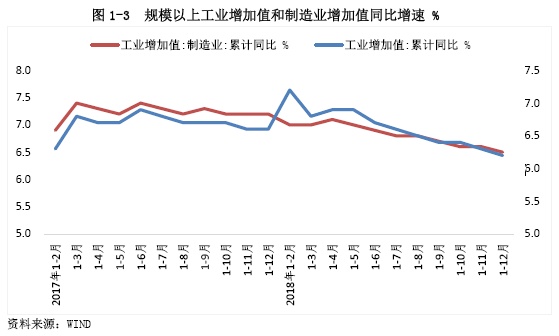
2. The growth rate of industrial production has slowed down steadily. In 2018, the added value of industrial enterprises above designated size increased by 6.2% year-on-year, and the growth rate dropped by 0.4 percentage points compared with 2017, showing a steady slowdown. Among the three categories, the mining industry has accelerated its production, and the cumulative year-on-year growth rate of the added value of the industry in the whole year is 3.8 percentage points faster than that in 2017, mainly due to rising prices, high profits, reduced capacity and environmental protection and limited production. The cumulative year-on-year growth rate of added value of electricity, heat, gas and water production and supply industries was 1.8 percentage points faster than that of 2017, which was consistent with the growth trend of power generation in the same period, mainly reflecting the impact of changes in energy structure. Due to the weakening of terminal demand, the cumulative year-on-year growth rate of manufacturing added value, which accounts for nearly 90% of the industry, dropped by 0.7 percentage points compared with 2017, which dragged down the growth rate of industrial added value in 2018 (Figure 1-3).
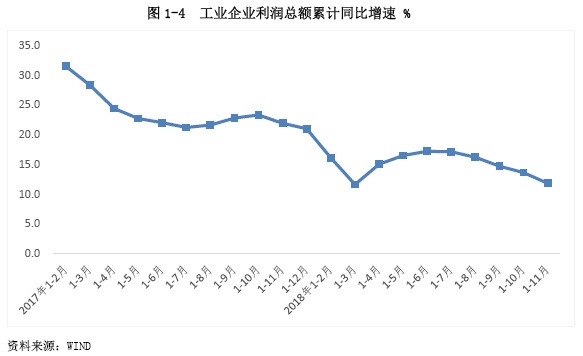
The profits of industrial enterprises grew rapidly, and the trend was high before and low after the year. In the first 11 months of 2018, the total profit of industrial enterprises above designated size increased by 11.8% year-on-year, and the growth rate decreased by 9.2 percentage points compared with the same period in 2017. From the trend of the year, with the decline of PPI growth rate and the impact of industrial production slowdown on corporate profits, the profit growth rate of industrial enterprises dropped sharply in the second half of the year, and the year-on-year growth rate in November dropped to -1.8%, which was the first negative year-on-year increase in the past three years (Figure 1-4).
(3) Investment in fixed assets
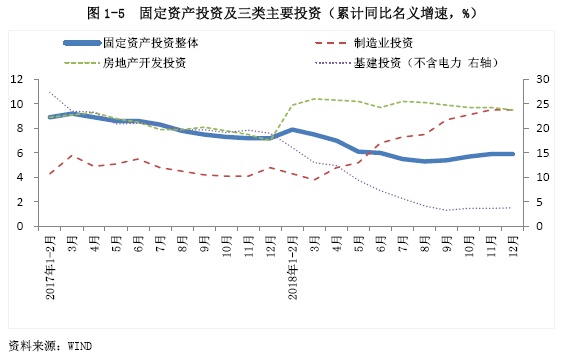
1. Infrastructure investment slowed sharply, and investment kinetic energy accelerated to switch. In 2018, the national fixed asset investment increased by 5.9% year-on-year, and the growth rate dropped by 1.3 percentage points compared with 2017, mainly due to the drag of infrastructure investment. From the perspective of the three major types of investment, the growth rate of infrastructure investment slowed down significantly. The annual infrastructure investment (excluding electricity) increased by 3.8% year-on-year, significantly lower than the 19% in 2017, while the growth rate of real estate and manufacturing investment accelerated (Figure 1-5).
The weakening of infrastructure investment in 2018 reflects the impact of strict supervision: First, the source of funds is limited. Local government debt supervision has been continuously strengthened, financing platforms have been strictly constrained, and off-balance sheet financing has continued to shrink sharply. Second, the centralized rectification of PPP has led to the suspension of some infrastructure projects, thus impacting infrastructure investment.
It is worth noting that the growth rate of infrastructure investment in the third quarter rarely increased negatively. From July to September, the growth rate of infrastructure investment was -1.8%, -4.3% and -1.9% respectively. Since the fourth quarter, with the macro-policy turning to steady growth, the short board of infrastructure has begun to accelerate, driving the monthly growth rate of infrastructure investment back to the positive range. The year-on-year growth rate of infrastructure investment in October-December was 6.7%, 3.7% and 3.8% respectively. Further, the stabilization of infrastructure has led to a rebound in the growth rate of fixed asset investment.
2. The growth rate of real estate investment has accelerated, while sales have slowed down. In 2018, real estate investment increased by 9.5% year-on-year, and the growth rate was 2.5 percentage points faster than that in the same period of 2017, mainly due to the sharp year-on-year increase in new construction area driven by previous destocking and higher land acquisition expenses. During the year, the newly started area increased by 17.2% year-on-year, and the growth rate was greatly accelerated by 10.2 percentage points compared with 2017 (Figure 1-6); From January to November, the land purchase fee increased by 60.5% year-on-year, and the growth rate was 38.6 percentage points faster than that of the same period in 2017.
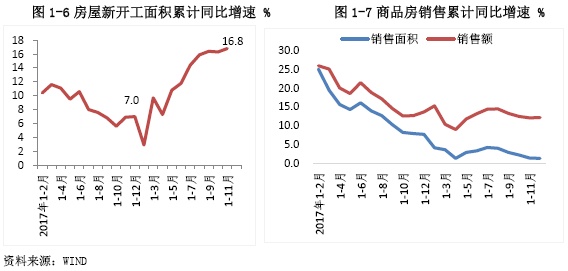
In 2018, the year-on-year growth rate of commercial housing sales area and sales was 1.3% and 12.2%, respectively, which was lower than that in 2017 and the first three quarters (Figure 1-7). The cooling market sentiment led to a slowdown in investment in the fourth quarter. From October to December, the growth rate of real estate investment was 7.7%, 9.3% and 7.8% respectively, which was significantly lower than the high point in July (13.2%).
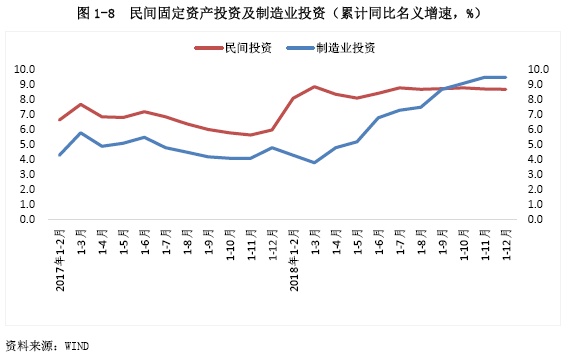
3. The supporting role of new kinetic energy is enhanced, the marginal capacity of traditional industries is weakened, and the growth of manufacturing investment is accelerated. In 2018, manufacturing investment increased by 9.5% year-on-year, and the growth rate was 4.7 percentage points faster than that in 2017. From the perspective of sub-sectors, in 2018, investment in traditional manufacturing industries such as automobile manufacturing, food and beverage, textile and clothing, and chemical industry continued to be weak, while investment in high-tech manufacturing industries such as special equipment, computers, communications, and other electronic equipment maintained rapid growth, and new kinetic energy became the main support of the manufacturing industry. In addition, due to the marginal weakening of the policy of de-capacity, investment in industries related to de-capacity, such as steel, non-ferrous metals and non-metallic mineral products, rebounded, and the growth rate of investment in manufacturing industry was boosted to some extent.
It is worth mentioning that in 2018, private fixed assets investment increased by 8.7% year-on-year, and the growth rate rebounded by 2.7 percentage points compared with 2017 (Figure 1-8). Private investment is mainly concentrated in manufacturing industry, which is consistent with the rebound of manufacturing investment growth rate in the same period. However, the lower profits of industrial enterprises and the trade friction between China and the United States may adversely affect private investment.
(4) Consumption
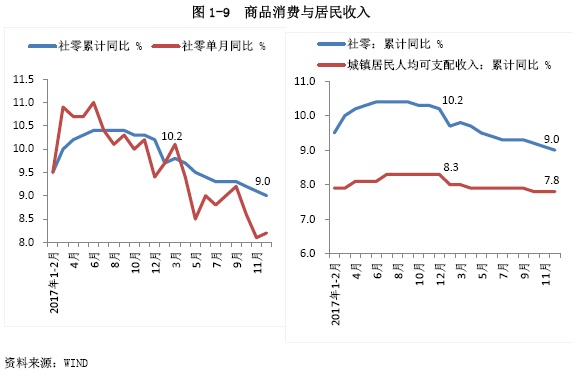
1. The slight decrease in income has slowed down the zero growth rate of the society, and the consumption structure has shifted from physical objects to services. In 2018, the total retail sales of social consumer goods increased by 9.0% year-on-year, and the growth rate dropped by 1.2 percentage points compared with 2017. On the one hand, this steady and slightly declining trend is consistent with the income trend of residents: in 2018, the per capita disposable income of urban residents nationwide increased by 7.8% year-on-year, and the growth rate dropped by 0.5 percentage points compared with 2017. On the other hand, in 2018, the per capita consumption expenditure of urban residents increased by 6.8% year-on-year, and the growth rate was 0.9 percentage points faster than that in 2017, which deviated from the downward trend of zero social growth rate reflecting commodity consumption, indicating that residents’ service consumption is accelerating and confirming the transformation of consumption structure (Figure 1-9).
2. Consumption of commodities above designated size is generally depressed, with the decline of automobile retail sales as the main drag. Looking at the retail sales of various categories of goods above designated size, the growth rate of retail sales of most categories of goods in 2018 was not as fast as that in the same period of 2017, among which the retail sales of automobiles, which accounted for about 30% of the total, decreased by 2.4% year-on-year, and the growth rate decreased by 8.0 and 2.6 percentage points respectively compared with the same period of 2017 and the first three quarters. Since May, the automobile retail sales have been continuously negative growth, and the decline at the end of the year has expanded to about 10%, which has become the main reason for the overall decline in the zero growth rate of the society.
New formats such as online consumption remain active. In 2018, the national retail sales of online goods and services increased by 23.9% year-on-year, and the growth rate was 8.3 percentage points lower than that in 2017, but it was still in the high-speed growth range. The online retail sales of physical goods increased by 25.4% year-on-year, which was 16.4 percentage points higher than the total retail sales of social consumer goods, accounting for 18.4% of the total retail sales of social consumer goods, up 3.4 percentage points from 2017.
(5) Import and export
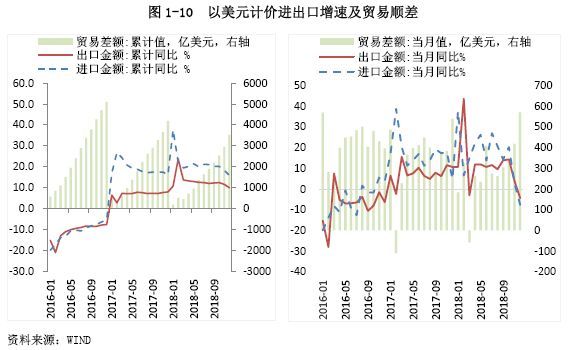
1. Foreign trade achieved rapid growth, and the trade surplus narrowed significantly. In dollar terms, the total import and export value of China’s goods trade increased by 12.6% year-on-year in 2018, and the growth rate was 1.2 percentage points faster than that in 2017. Among them, exports increased by 9.9% year-on-year, and imports increased by 15.8% year-on-year, both of which maintained a relatively rapid growth momentum (Figure 1-10). It should be noted that the year-on-year growth rate of China’s imports and exports in the fourth quarter dropped significantly compared with the previous three quarters, due to the weakening of internal and external demand, the weakening of the effect of "grabbing exports" and the weakening of the supporting role of price factors, so the trend in the year was high before and low after. According to our calculation, the import and export volume in the fourth quarter increased by 4.4% and 4.0% respectively, which was significantly lower than the cumulative growth rate of 20.2% and 12.2% in the previous three quarters.
In terms of trade balance, China’s foreign trade surplus in 2018 totaled US$ 351.8 billion, down 16.2% year-on-year, indicating that the pull of net exports of commodity trade on economic growth continued to weaken.
2. The global economy affects China’s export trend, and the impact of Sino-US trade friction is becoming more and more obvious. In 2018, China’s export volume increased by 9.9% year-on-year, and the growth rate was 2.0 percentage points faster than that in 2017, reflecting that external demand remained strong in general under the background of the continuous expansion of the external economy.
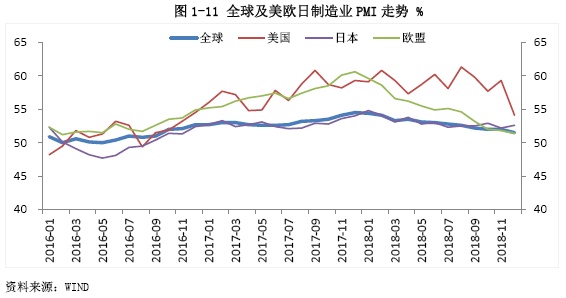
From the trend of the year, the momentum of global economic expansion slowed marginally in 2018, and the manufacturing PMI continued to decline from 54.4% at the beginning of the year to 51.2% at the end of the year (Figure 1-11). Among the major economies, the economic growth momentum of the euro zone and Japan tends to weaken, and only the US economy is stimulated by tax cuts to grow strongly. The Federal Reserve’s interest rate hike and the rise of the US dollar index led to the intensification of macroeconomic fluctuations in a number of emerging markets, and the local currency depreciated significantly. The weakening of external fundamentals is the main reason why the growth rate of China’s export trade was high before and then low during the year.
Since 2018, the trade friction between China and the United States has been heating up [4], which has a great impact on market sentiment. However, the relevant tariff measures have only officially landed since the second half of the year, and the impact of the increase in tariff rate on the import and export trade volume has to be filtered by factors such as tariff conductivity and price elasticity of demand, as well as the phenomenon of "grabbing exports" from the United States. Therefore, from the perspective of the whole year, Sino-US trade friction has not significantly dragged down China’s export growth. However, with the decline of the "export-grabbing" dividend, the impact of export demand overdraft appears, and the negative effects of Sino-US trade friction will gradually be released, which has been reflected in the export data in December.
3. Higher commodity prices have superimposed policy effects, and imports have maintained high growth. In 2018, China’s imports increased by 15.8% year-on-year. Under the background of high base and weak domestic demand, China’s imports continued to grow at a high speed in 2018, which benefited from three factors: First, the marginal domestic demand weakened, but the overall resilience was strong, which played a fundamental role in driving import growth; Second, the rebound in crude oil prices has led to higher commodity prices, which have obviously supported the growth rate of imports; Third, the intensive introduction of import expansion policies in 2018 has played a certain role in boosting import growth.
However, the growth rate of imports slowed down significantly at the end of the year, and the import volume in December turned negative year-on-year, with a drop of 7.6%, the lowest in nearly two and a half years. On the one hand, the impact of slowing domestic demand on import demand has gradually emerged. As of December, China’s manufacturing import PMI index has been in a contraction range for six consecutive months; On the other hand, due to the slowdown of global economic growth, the price increase of major commodities and industrial products weakened and the year-on-year increase generally narrowed, and the supporting role of price factors on import growth decreased accordingly.
(6) Prices
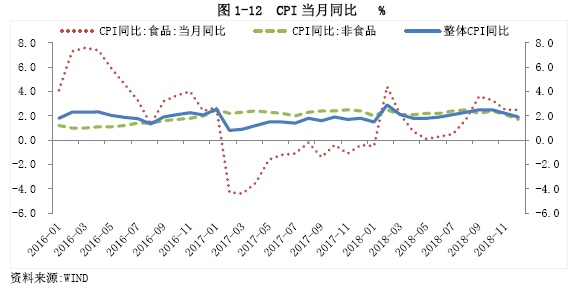
1. CPI has risen significantly year-on-year, but it is still at a moderate growth level. In 2018, CPI increased by 2.1% year-on-year, with an increase of 0.5 percentage points compared with 2017, which exceeded 2.0% for the first time in four years. During the year, the CPI generally showed a trend of low before and then high. Excluding the disturbance of the Spring Festival in January and February, the CPI peak appeared in September and October, with a year-on-year increase of 2.5%. However, since November, the upward trend of CPI has obviously eased, and the year-on-year increase in December has dropped to 1.9%, mainly due to the sharp drop in international oil prices, the continuous downward adjustment of domestic refined oil prices and the lower price of pork. Overall, although the year-on-year growth rate of CPI has increased, it is still in a moderate range, which has not constrained monetary policy (Figure 1-12).
It is worth noting that pork prices have a great influence on the trend of CPI. In 2018, pork prices showed a trend of falling first, then rising and then falling. Due to the prominent contradiction between supply and demand, pork prices continued to fall in the first half of the year and the decline expanded month by month, dragging down CPI year-on-year. Since June, the sluggish pig market and local epidemics have caused the supply of pork to tighten, and the superimposed trade friction has pushed up the price of soybean meal. The price of pork has stabilized and rebounded, and the year-on-year decline has narrowed month by month, and the CPI has also rebounded simultaneously. In the fourth quarter, pork prices generally declined due to the effect of "grabbing the column" caused by the expansion of swine fever epidemic.
2. The high cardinal number superimposed the balance of supply and demand, and the PPI dropped significantly year-on-year. In 2018, PPI increased by 3.5% year-on-year, which was 2.8 percentage points lower than that in 2017 (Figure 1-13). The main reason is the high base in 2017, coupled with the weakening of supply-side capacity reduction and environmental protection and limited production, the decline in demand-side investment and consumption growth, and the decline in support for PPI. From the trend point of view, except for the sharp rise in international oil prices in the second quarter, which led to the rebound of domestic PPI, the year-on-year growth rate of PPI declined as a whole, with the highest month-on-year increase in June (4.7%) and the lowest in December (0.9%).
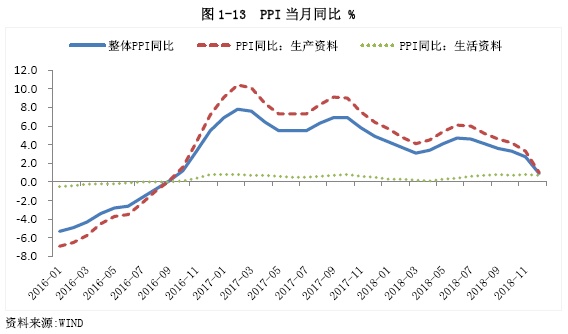
It is worth noting that the year-on-year growth rate of PPI in 2018 is highly resonant with the growth rate of international oil prices, indicating that oil prices continue to be a key variable affecting the PPI trend. In the first three quarters, international oil prices fluctuated, and the year-on-year growth rate fluctuated since March, boosting the domestic PPI to rise continuously from May, and the year-on-year growth rate also exceeded general expectations. However, since the fourth quarter, the international oil price has plunged continuously after hitting the high point of the year in early October, which reflects the combined influence of weakening demand expectations, the weaker impact of the situation in the Middle East on supply and the higher US dollar index. As a result, the pulling effect of oil prices on PPI has been weakened accordingly, which has become an important reason for the decline of PPI since November and the acceleration of the year-on-year growth rate.
(7) Exchange rate
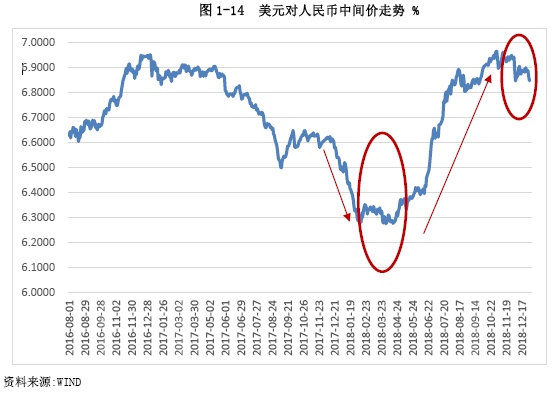
1. The exchange rate of RMB against the US dollar has obvious amplitude and twists and turns. From the beginning of 2018 to the beginning of February 2018, the RMB basically showed an upward trend against the US dollar, and the central parity of the US dollar against the RMB dropped from 6.50 to 6.28. By the end of April, it basically fluctuated around 6.30, which was stable as a whole. From May to the beginning of December, the RMB started an obvious devaluation against the US dollar, and the central parity of the US dollar against the RMB rose unilaterally from 6.36 to 6.94, setting a new high in two years. Subsequently, by the end of 2018, the RMB appreciated slightly against the US dollar, and the central parity of the US dollar against the RMB finally closed at 6.84. From the annual trend, the exchange rate of RMB against the US dollar can be described as twists and turns, and the highest amplitude of the middle price during the year [5] is close to 11% (Figure 1-14).
The reasons for the change of RMB exchange rate against the US dollar in 2018 include both internal and external factors, among which external factors have a greater impact. Externally: First, the US dollar index has changed in the same period, and the trend of the US dollar index basically corresponds to the RMB exchange rate. In 2018, the US dollar index showed a trend of "falling before and then rising", with the end of April as the dividing point. Before that, it basically fluctuated around 90, and at the lowest time, it went all the way, reaching the highest of 97.69. The strength of the US dollar drives the depreciation of non-US dollar currencies, including RMB. Second, the divergence of monetary policies between China and the United States has led to the narrowing of spreads between the two countries. Under the background of the Fed’s interest rate hike, the People’s Bank of China did not follow the domestic real economy situation, which led to the narrowing of the spread between China and the United States, thus suppressing the exchange rate of RMB against the US dollar to some extent. Internally, in 2018, the degree of marketization of RMB exchange rate will be further improved, which will obviously enhance the flexibility of two-way floating of RMB exchange rate, and exchange rate fluctuation under the influence of market supply and demand is a normal phenomenon. In fact, the current exchange rate of RMB against the US dollar is only a phased adjustment. If the observation period is extended, we can find that the exchange rate in 2018 has not deviated from the reasonable operating range (Figure 1-14).
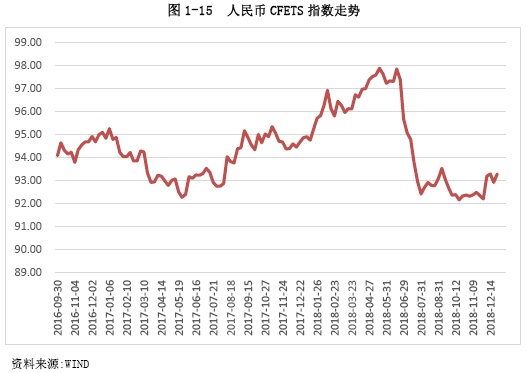
2.CFETS index rises first, then falls and then stabilizes. In 2018, the CFETS index fluctuated due to the fluctuation of the exchange rate of major currencies caused by the change of the US dollar index (Figure 1-15). Taking the middle of the year as a watershed: the first half of the year showed a volatile upward trend, rising from 94.90 at the beginning of the year to 97.38 at the end of June. The main reason is that the currencies of other major countries have depreciated against the US dollar at this stage, while China’s economy has strong resilience and the fundamentals support the CFETS index to stabilize. In the second half of the year, it began to turn into a falling range, all the way down to below 93, but it gradually stabilized in the fourth quarter and rose slightly at the end of the year. The decline of CFETS index in the second half of the year is mainly caused by two factors: first, the monetary policy of major countries began to tighten marginally in the second half of the year, while China’s monetary policy was stable and slightly loose, which was not conducive to overseas capital inflows; Second, the trade friction between China and the United States has warmed up, which has increased the uncertainty of China’s foreign trade prospects and led to the warming of RMB bear sentiment.
Second, macroeconomic policies
(A) fiscal policy
1. The growth rate of fiscal revenue is high before and then low. In 2018, the proactive fiscal policy was gradually strengthened, and the growth rate of fiscal revenue gradually slowed down. Judging from the growth rate of national general public budget revenue, the growth rate in the second half of the year was 4.2 percentage points lower than that in the first half. From January to December, the national general public budget revenue exceeded 18.33 trillion yuan, an increase of 1.08 trillion yuan over 2017 and a year-on-year increase of 6.2%. Among them, the central general public budget revenue was 8.54 trillion yuan, a year-on-year increase of 5.3%; The local general public budget revenue at this level was 9.79 trillion yuan, a year-on-year increase of 7%. The tax revenue in the national general public budget revenue was 15.64 trillion yuan, an increase of 8.3% year-on-year, and the growth rate dropped by 2.4 percentage points compared with 2017; Non-tax revenue was 2.69 trillion yuan, a year-on-year decrease of 4.7%.
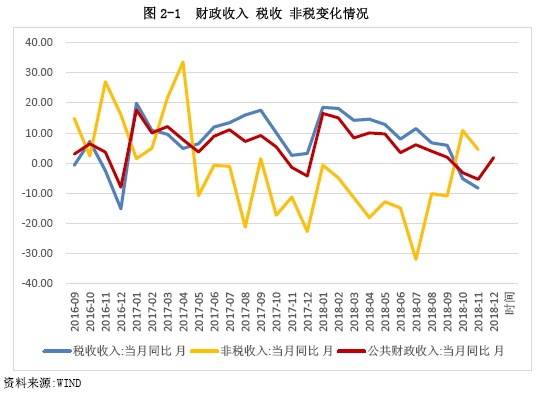
First, the steady and slow trend of fiscal revenue is obvious. From the perspective of the whole year, the fiscal revenue growth is generally stable, and the cumulative year-on-year growth rate from January to December is only 1.2 percentage points lower than that in 2017. However, on a monthly basis, it basically slowed down month by month, and the growth rate was negative in October and November. This shows that the growth rate of fiscal revenue in the whole year can remain basically stable, mainly due to the rapid growth in the first half of the year. As the effect of tax reduction and fee reduction policy is gradually released in the second half of the year, the slowdown in tax growth drives the fiscal revenue growth to slow down (Figure 2-1).
Second, tax cuts have significantly reduced the growth rate of tax revenue. In the first half of 2018, due to the stabilization of industrial product prices, the moderate increase in consumer prices, and the high prosperity of industry, commerce and service industries, the circulating taxes represented by value-added tax and consumption tax grew rapidly, thus driving the fiscal revenue to maintain high growth. In the second half of the year, the executive meeting of the State Council established the policy requirement of "active fiscal policy should be more active", and the degree of tax reduction and fee reduction increased significantly, which led to a significant decline in the growth of corporate income tax, personal income tax and value-added tax in the second half of the year, and the fiscal revenue began to slow down, and even decreased year-on-year in the fourth quarter.
Third, the fee reduction has led to a continuous negative increase in non-tax revenue. Affected by the intensified measures to reduce fees and the regulation of non-tax revenue in some areas, the year-on-year growth rate of non-tax revenue in China was always negative in 2018, and the year-on-year growth rate in July was as low as -31.93%, the lowest growth rate since January 2016 (Figure 2-1). At the same time, the continuous decline in non-tax revenue has also led to an increase in the proportion of tax revenue. In 2018, the proportion of national tax revenue to fiscal revenue increased by 1.65 percentage points year-on-year to 85.30%.
Fourth, the income progress is fast first and then slow. The progress of fiscal revenue in 2018 [6] has been accelerated compared with that in 2017. Since February, the progress of fiscal revenue has always been about 1.5 percentage points ahead of the same period in 2017, indicating the impact of rapid revenue growth in the first half of the year. Since July, the progress of fiscal revenue has gradually slowed down, which is about 0.8 percentage points ahead of the same period in 2017, and the leading gap has gradually narrowed, which was 0.07 percentage points in September. Since October, the progress of fiscal revenue in 2018 has begun to lag behind that in 2017, and the effect of tax reduction and fee reduction has gradually become apparent.
2. The fiscal expenditure maintained a high intensity, and the expenditure progress was generally accelerated. From January to December, the national general public budget expenditure was 22.09 trillion yuan, an increase of 810.9 billion yuan compared with the same period in 2017, an increase of 8.7%. Among them, the central general public budget expenditure at this level was 3.27 trillion yuan, up 8.8% year-on-year; The local general public budget expenditure was 18.82 trillion yuan, up 8.7% year-on-year.
First, the growth rate is basically flat, and the expenditure intensity is not reduced. In 2018, the national general public budget expenditure increased by 8.7% year-on-year, 1 percentage point faster than that in 2017. The annual expenditure showed a trend of slow before and then fast, and the scale of expenditure in the second half of the year increased significantly compared with that in the first half of 2017, which was related to the high base in the first half of 2017 and the obvious strength of fiscal expenditure in the second half of 2018. Overall, the intensity of fiscal expenditure in 2018 is relatively high. In the first quarter, the first half of the year and the first three quarters, the national general public budget expenditure progress reached 24.3%, 53.2% and 77.8% respectively, and the annual public budget expenditure scale exceeded 22 trillion yuan.
Second, fiscal expenditure is more cohesive and efficient. Reflected in the further optimization of the fiscal expenditure structure, financial support in the three major battles, people’s livelihood expenditures and key areas has increased. In 2018, various people’s livelihood-related expenditures [7] maintained rapid growth year-on-year; The annual expenditure on poverty alleviation reached 477 billion yuan, a year-on-year increase of 46.6%; Expenditure on pollution prevention and natural ecological protection increased by 29.6% and 17.5% respectively. Expenditure on social security and employment, and expenditure on subsidies from basic old-age insurance funds increased by 9.7% and 11.4% respectively.
Third, the proportion of infrastructure expenditure in the second half of the year rose to a high point in recent years. In 2018, the growth rate of China’s infrastructure investment showed a significant decline, and the fiscal expenditure fully played a countercyclical hedging role. The three infrastructure expenditures (transportation, agriculture, forestry and water affairs, and urban and rural community affairs) maintained a high intensity, and showed a trend of slow before and fast after. In the first half of the year, the tightening of local debt supervision led to a decrease in the scale of off-budget infrastructure expenditure and weakened the overall infrastructure investment. Therefore, the effect of fiscal expenditure on hedging infrastructure decline was not significant: from January to June, the year-on-year growth rates of transportation and agriculture, forestry and water affairs expenditures accelerated by 0.5 and 3.7 percentage points respectively compared with the same period of 2017, but the year-on-year growth rate of infrastructure investment (excluding electricity) decreased by 13.8 percentage points compared with the same period of 2017. In the second half of the year, infrastructure expenditure began to accelerate gradually, which led to the stabilization of the growth rate of generalized infrastructure since October. In 2018, three infrastructure expenditures accounted for 24.7% of the total expenditure, which was 3 percentage points higher than that in 2009, when the expansionary fiscal policy was the most obvious.
3. The issuance of local government bonds increased significantly. Since 2018, under the tone of active fiscal policy, the scale of local government bond issuance has increased moderately, and the overall situation is slow before and then fast. In the first half of the year, under the influence of factors such as stricter local debt supervision and larger replacement quota, the pace of issuing new special bonds slowed down compared with previous years. From January to June, a total of 1.41 trillion yuan of local government bonds were issued, of which only 332.9 billion yuan were issued. At the meeting of the Political Bureau at the end of July, the proactive fiscal policy should be strengthened. In August, the Ministry of Finance issued a document [8] explicitly requesting to speed up the issuance of local government special bonds, and then the scale of special bond issuance increased significantly: from August to December, a total of 1.99 trillion yuan of local government bonds were issued, of which 1.38 trillion yuan of new bonds were issued.
(B) credit and monetary policy
1. Monetary policy focuses on the domestic market and has undergone many marginal adjustments. In 2018, China’s monetary policy will face both internal and external challenges. External uncertainties such as growth differentiation and trade friction between China and the United States weaken the independence of monetary policy, and multiple internal factors such as capital market turmoil and the downturn of the real economy hinder the implementation of the policy. Facing the complicated objective situation, China’s monetary policy has always served the needs of domestic economic operation, taking into account the internal and external balance.
On the premise of overall stability, monetary policy pays more attention to countercyclical adjustment, timely pre-adjustment and fine-tuning, and there is marginal change in tightness, and the liquidity fundamentals switch accordingly: in the first half of the year, the general tone of stability and neutrality was maintained, and it was clearly put forward that "the general gate of money supply should be managed well", and the liquidity environment was neutral and moderate; In the second half of the year, the weight of "steady growth" in the policy mix increased significantly, monetary policy appeared moderate structural easing, the liquidity of the financial system remained reasonable and abundant, and it gradually changed to "wide credit". Generally speaking, monetary policy in 2018 focuses on three key tasks: unblocking the transmission mechanism, solving the financing difficulties of private and small and micro enterprises, and coping with excessive fluctuations in asset prices.
First, give consideration to the internal and external balance, and "inside" and "outside". "Focus on China" is the core principle of monetary policy in 2018. From the high-level statement, President Yi Gang has repeatedly stated in public that the main basis of China’s monetary policy is the comprehensive consideration of domestic fundamentals, and the main goal is to serve the domestic real economy. From the specific practice, in 2018, the Federal Reserve raised interest rates four times, but the People’s Bank of China did not obviously follow the will. During the year, it implemented two targeted cuts to required reserve ratios, two RRR cuts, and three increases in refinancing and rediscount quotas; At the beginning of October, the yield of US bonds rose sharply. On October 15, the People’s Bank of China released 750 billion yuan of incremental funds by replacing the RRR cut. It can be seen that the logic of monetary policy is "to stabilize internal and external pressures with internal stability", and to ensure the stability of various indicators at a reasonable level by improving domestic economic fundamentals.
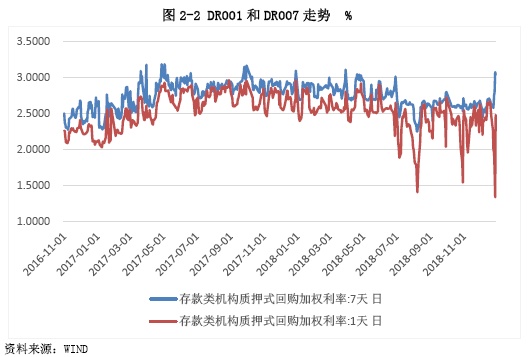
The second is to maintain stability and fine-tune. In 2018, the general tone of monetary policy remained stable and neutral, and the liquidity was reasonably abundant. According to the data, the average value of DR007 during the year was about 2.71%, which was 10BP lower than that in 2017, reflecting the effect of a prudent neutral monetary policy; The average value of DR007 in the first half of the year was 2.82%, and it dropped to 2.61% in the second half of the year, and the interest rate center moved down, reflecting that the monetary policy was more flexible and the tightness was fine-tuned during the year. Only seven working days in DR007 exceeded 3%, 10 days less than that in 2017, and all of them were at the end of the quarter and the end of the year, which indicated that the overall funds were stable and loose (Figure 2-2).
The third is to highlight the countercyclical period and focus on stabilizing expectations. Since the second quarter of 2018, the pressure of domestic economic downturn and exchange rate depreciation has increased significantly. Correspondingly, the countercyclical adjustment role of monetary policy has been continuously strengthened, and efforts have been made to guide and stabilize expectations. Under this premise, policy tools are more flexible and liquidity management methods tend to be refined: in the first half of the year, MLF will be replaced by RRR cuts, and incremental funds will be used to support private enterprises and small businesses; Expand the scope of MLF collateral [9]; Increase the amount of refinancing and rediscount for supporting small farmers, and lower the interest rate of refinancing for small farmers; In the second half of the year, targeted cuts to required reserve ratios supported "debt-to-equity swap" and microfinance; Raise the risk reserve ratio of forward foreign exchange sales business to 20%; Issuing central bank bills in Hong Kong to enrich offshore RMB liquidity adjustment tools; Create a targeted medium-term lending facility (TMLF). These measures are effective and precise, so as to ensure that the economy runs smoothly in a reasonable range in 2018, the financial market is expected to stabilize, and the macro leverage ratio is stable at a moderate level.
The fourth is to emphasize dredging transmission and improve the effectiveness of policies. In 2018, the People’s Bank of China repeatedly emphasized to further unblock the transmission mechanism of monetary policy, which was mentioned six times in the implementation report of monetary policy in the second quarter, aiming at breaking through the structural and local constraints of liquidity transmission, realizing "wide credit" and promoting the formation of a virtuous circle of finance and the real economy. Therefore, the monetary policy has obvious characteristics of "directional transportation+structural support", and all previous popular investments are to support the real economy, especially the financing of private and small and micro enterprises. Specifically, it includes: targeted cuts to required reserve ratios for many times, limiting the use of funds for RRR reduction, relaxing the limit on the proportion of local debt underwriting, guiding the allocation of high-grade credit bonds through the window, and simultaneously exerting efforts from three channels: loan, debt and stock through the "three arrows". There are two results: first, ensure that the total liquidity matches the real economy and avoid "flooding"; The second is to optimize the liquidity structure, improve the financing environment of the private economy, and avoid the "capital barrier lake".
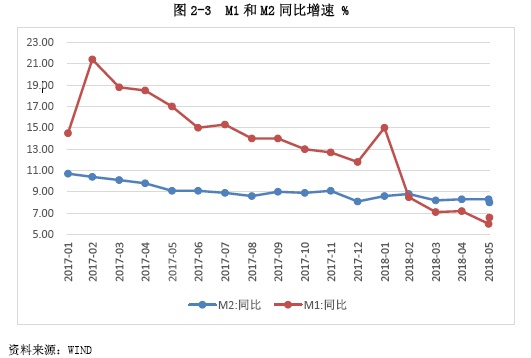
2. The overall money supply is moderate, and the scale of social financing has dropped significantly. In 2018, the growth rate of China’s money supply further decreased and remained at a low level. By the end of the year, the balance of M2 was 182.67 trillion yuan, up 8.1% year-on-year, and the year-on-year growth rate of M2 balance at the end of each month was lower than 8.5%. The balance of M1 was 55.17 trillion yuan, up by 1.5% year-on-year, down by 10.3 percentage points compared with the same period in 2017, and the growth rate was basically decreasing month by month. The rapid decline in the growth rate of M1 leads to a further widening of the scissors gap between M1 and M2 in the second half of the year (Figure 2-3).
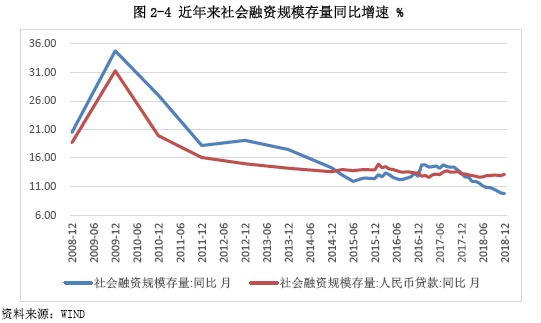
At the same time, the year-on-year growth rate of social financing scale stock decreased month by month, and hit new lows (Figure 2-4). At the end of 2018, the stock of social financing scale was 20.075 billion yuan, a year-on-year increase of 9.8%; The scale of social financing increased by 19.26 trillion yuan, a decrease of 3.14 trillion yuan compared with 2017; In particular, in May, the new social integration was "waist-to-waist", and in October, the new social integration decreased by nearly 66%.
First, the low money supply has become the "new normal". In 2018, the money supply always maintained a low growth rate. From the first quarter to the end of the fourth quarter, the year-on-year growth rate of M1 was 7.1%, 6.6%, 4% and 1.5% respectively, and the year-on-year growth rate of M2 was 8.2%, 8%, 8.3% and 8.1% respectively. On the one hand, this is the result of the coordinated and effective promotion of stable neutral monetary policy and financial supervision policy, which is conducive to controlling the internal leverage of the financial system and reducing the nested cycle of funds [10]. On the other hand, this is the inevitable result of the high-quality development stage of economy and finance. The growth rate of M1 dropped continuously, mainly due to the rapid development of third-party payment and money market funds, and the slowdown in sales caused by real estate regulation. The growth rate of M2 is obviously lower than that of previous years, and the average growth rate in the year is slightly lower than the sum of GDP growth rate and CPI growth rate in the same period by 0.44 percentage points, indicating that the current money supply is relatively matched with macroeconomic operation, and a stable monetary and financial environment is helpful to ensure the economic operation in a reasonable range.
Second, the overall social integration has shrunk and the structure has been optimized. In 2018, structural deleveraging continued to advance, the effect of strict financial supervision continued to ferment, and the risk appetite of the financial system declined, which led to a sharp decrease of 2.93 trillion yuan in off-balance sheet financing for the whole year, an increase of 6.5 trillion yuan year-on-year. The growth rate of social financing scale stock hit record lows, and the incremental scale was far less than that of the same period in 2017. However, after the non-standard financing such as interbank financing, channel financing and bank financing was squeezed out, a large number of off-balance-sheet assets were returned to the table in an orderly manner. In the second half of the year, the People’s Bank of China increased the medium-and long-term liquidity, and the local government issued a large amount of special bonds from August to October. These factors jointly boosted the proportion of on-balance-sheet credit and bond financing, which became the main support for social financing in 2018, and the social financing structure was optimized. In 2018, the proportion of new RMB loans and corporate bond financing in the scale of social financing was 81.36% and 12.88%, respectively, a significant increase of 10.2 and 10.6 percentage points compared with 2017. In addition, due to the volatility of the capital market, domestic stock financing of non-financial enterprises decreased by 515.3 billion yuan in 2018.
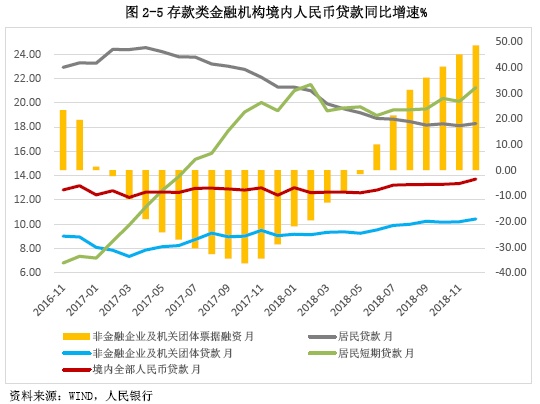
Third, credit tends to be short-term. In 2018, driven by the weakening of the real estate market, the high risk aversion of commercial banks and the low willingness of enterprises to invest and finance, the growth rate of short-term loans of residents and enterprises was significantly faster than that of medium-and long-term loans. In particular, the growth rate and proportion of bill financing increased significantly compared with the same period of last year, which made a great contribution to the overall credit growth. By the end of 2018, the balance of RMB loans of deposit-taking financial institutions (domestic, the same below) was 135.33 trillion yuan, up by 13.71% year-on-year, of which the balance of RMB loans of residential departments was 47.27 trillion yuan, up by 18.29% year-on-year, and short-term loans of residents increased by 21.25% year-on-year. The balance of RMB loans of non-financial enterprises was 84.53 trillion yuan, up 10.43% year-on-year, and the balance of bill financing of non-financial enterprises was 5.78 trillion yuan, up 48.71% year-on-year (Figure 2-5).
Fourth, the bond market financing first declined and then increased. In 2018, the financing function of China’s bond market was gradually restored. In the first half of the year, there was a wave of default in the credit bond market, and the performance of the local government bond market was relatively dull. Since the second half of the year, the fiscal policy has become more active, and the issuance of special bonds by local governments has obviously accelerated; The monetary policy is marginally relaxed, the liquidity gradually turns to be reasonable and abundant, and the long-term interest rate and the issuance interest rate go down accordingly [11], and private enterprise bond financing is supported through credit risk mitigation tools. Stimulated by the above favorable policies, the bond market financing picked up significantly in the second half of the year, which led to an increase in the scale of bond financing throughout the year: in 2018, the net financing amount of corporate bonds was 2.48 trillion yuan, a substantial increase of 2.03 trillion yuan compared with 2017; Local government special bonds issued 1.94 trillion yuan, and the accumulated financing amount was 1.79 trillion yuan.
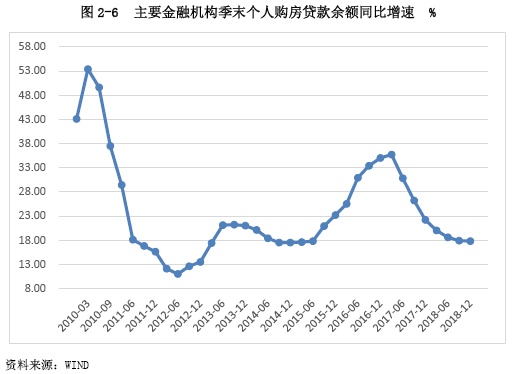
3. Structured deleveraging was solidly promoted, and the macro leverage ratio stabilized. In 2018, China’s macro leverage ratio was basically controlled and gradually stabilized, and the leverage ratio has stabilized at around 250% in the past eight quarters. At the same time, with the continuous advancement of real estate regulation and control, the growth rate of real estate loans dropped steadily. At the end of the year, the balance of RMB real estate loans was 38.7 trillion yuan, down 0.9 percentage points from 2017; During the year, new real estate loans reached 6.45 trillion yuan, accounting for 1.2 and 4.9 percentage points lower than those in 2017 and 2016, respectively. The upward trend of leverage ratio in the residential sector has been basically curbed. The balance of personal housing loans was 25.75 trillion yuan, with a year-on-year growth rate of 4.4 percentage points lower than that in 2017, and the year-on-year growth rate at the end of each quarter gradually decreased and was lower than 20% (Figure 2-6). Correspondingly, monetary policy gradually focuses on stabilizing leverage and structural deleveraging in order to achieve a balance between risk prevention and steady growth.
4. The depth of financial opening-up accelerated. In 2018, the pace of opening up in China’s financial sector was significantly accelerated, and the opening up of financial services entered a new pattern. In terms of policies, the proportion of foreign shares in the financial industry and the restrictions on business scope have been further relaxed, the market access standards of Chinese and foreign banks have approached unification, and the "pipeline" open system arrangement has been solidly promoted, which has promoted a more convenient and friendly domestic investment environment. On the market side, in 2018, overseas institutions increased their holdings in China’s bond market. During the year, the net inflow of foreign capital in the bond market was about 100 billion US dollars, accounting for 80% of the inflow of foreign capital in emerging markets. By the end of 2018, the proportion of foreign investors holding debt in China’s bond market reached 2.3%, and the proportion of national debt holding debt was 8.1%.
(3) Financial policy
1. The supervision has obviously strengthened its grasp of the rhythm and intensity. In 2018, financial supervision strives to find a balance between "strict supervision and risk prevention" and "wide credit and steady growth", which is a policy choice based on the objective economic situation. On the one hand, continuing the basic orientation of "strict supervision and risk prevention", the general trend of deepening financial deleveraging has not changed. In the first half of the year, the focus was on eliminating regulatory arbitrage, gradually promoting the shift from separate supervision to functional supervision, and further improving the coordination of supervision; New rules for landing asset management, maximizing arbitrage space, etc. On the other hand, to implement the spirit of the Politburo meeting in July, the word "stability" should take the lead in the second half of the year, avoiding "risks caused by risk prevention" and focusing on making up the shortcomings of supervision. The supporting rules of the new asset management regulations have been relaxed compared with market expectations; Emphasize different supervision and avoid "one size fits all"; Promote inclusive finance, increase credit support to relieve the financing difficulties of private enterprises, and effectively reduce the financing costs of entities.
2. Give play to the joint efforts of "several lifts" and enhance policy coordination. In 2018, financial regulatory policies actively cooperated with the implementation of fiscal and monetary policies, and strived to achieve the optimal policy mix and the maximum overall effect, so as to protect the smooth operation of the economy. On the one hand, guide financial institutions to help a more active fiscal policy. Cancel the upper limit of the investment ratio of commercial banks underwriting local government bonds to effectively undertake the issuance of local bonds; In accordance with the principle of marketization, increase financial support for the shortcomings in the infrastructure sector. On the other hand, with the multi-objective fine-tuning of monetary policy, through targeted credit supply, the financing difficulties of private and small and micro enterprises will be accurately alleviated to help stabilize growth; Adhere to strict supervision in key areas such as asset management, local debt and real estate credit to help stabilize leverage and prevent risks; Pay close attention to the introduction of supporting rules for the new regulations on asset management to help stabilize expectations.
3. The overall supervision has been further improved. In 2018, the idea of financial supervision reflected the characteristics of "unified supervision and overall development". The national institutional reform plan formally established a new regulatory pattern of "one committee, one line, two meetings", and achieved full regulatory coverage while making up the shortcomings. The meeting of the Finance Committee formally put forward the idea of "establishing a bond market with unified management and coordinated development", and the unified pace of credit rating business and market law enforcement mechanism between banks and exchange bond markets accelerated.
Third, the macroeconomic outlook
(A) China’s macroeconomic outlook in 2019
In 2019, under the background of the global economic downturn, there is still great uncertainty about the trend of Sino-US trade friction, which has different degrees of impact on consumption, investment, import and export. Combined with the decline of domestic labor force, the lower savings rate and the downward financial cycle, the overall economic operation will continue the process of economic downturn. It is estimated that the GDP growth rate will drop to 6.3%, which is 0.3 percentage points slower than that in 2018, but it is still in the middle and high-speed growth range.
In 2019, there are still many factors supporting economic growth. Macroeconomic policies will gradually exert their strength in the direction of steady growth, and the results of structural reforms on the supply side in the early stage will make room for countercyclical adjustment. In the process of urbanization, 10 million jobs are created every year, and the domestic consumption upgrade drives the service demand to grow rapidly, so there is still a lot of room for the development of high-end manufacturing. On the whole, there is still a large room for maneuver in economic operation in 2019, and the final result is likely to be "stable in change", and there will be no stall risk in economic growth.
It should be pointed out that with the negative impact of trade friction on the US economy gradually emerging, it is expected that the Trump administration’s enthusiasm for responding to China’s rational problem-solving will be enhanced. Therefore, in 2019, the risk of trade friction between China and the United States is controllable as a whole, and there is little possibility of trade decoupling in the world’s top two economies.
From the perspective of "three driving cars", 2019 will be characterized by "investment rebound, stable consumption and negative pull of net exports".
1. In terms of investment, the growth rate of investment in three categories of fixed assets will be "two drops and one liter", and the overall rebound will be expected, and the shortcomings of infrastructure construction are expected to play a bottoming role. In 2019, the downward pressure on the economy will increase, and the countercyclical adjustment of policies will be further exerted, which will support infrastructure investment. However, this round of infrastructure rebound will mainly play the role of "bottoming out" rather than "strong stimulus", and the policy direction of strictly controlling local debt risks will not completely turn. Therefore, it is unlikely that the growth rate of infrastructure investment in 2019 will reproduce the high growth rate in 2008 and 2013, and it is expected to rise to around 10.0%.
The growth rate of manufacturing and real estate investment will decline. On the one hand, factors such as the slowdown in corporate profit growth and the impact of Sino-US trade friction uncertainty on investor confidence will slow down the growth rate of manufacturing investment by about 3 percentage points in 2019. On the other hand, due to the cooling mood in the real estate market and the reduction of shed reform scale from 5.8 million to about 4.6 million, if the real estate policy is not significantly relaxed, the growth rate of real estate investment will drop to about 3.0% in 2019.
Therefore, it is estimated that the growth rate of fixed assets investment will be around 8.0% in 2019, which is about 2 percentage points higher than that in 2018, mainly reflected in the substantial acceleration of infrastructure investment, which accounts for about 27%, while the growth rate of manufacturing investment, which accounts for about 30%, will slow down slightly, and the growth rate of real estate investment, which accounts for nearly 17%, will drop significantly.
2. In terms of consumption, the effect of individual tax reduction appears, and the growth rate of commodity consumption is expected to stop falling and stabilize, and remain at around 9.0%. In 2019, the pull-down factors of commodity consumption mainly include the continued negative increase of automobile consumption, especially in the first half of the year; The contraction of the real estate market will also have a negative impact on the consumption of industrial chains such as building decoration, furniture and household appliances; The rapid growth of residents’ short-term loans in 2018 will continue to squeeze out consumption; The uncertainty of Sino-US trade war may also have a certain impact on consumer confidence.
At the same time, the favorable tax reduction will increase per capita disposable income, which is expected to support commodity consumption. Considering the factors such as the increase of tax starting point, the reduction of tax rate and special deduction, it is estimated that the tax reduction in 2019 will be about 400 billion yuan, and the total social zero will be about 40 trillion yuan in 2018. Under the assumption that the marginal propensity to consume remains 0.7, the tax reduction is expected to increase the social zero growth rate by 0.7 percentage points in 2019.
In addition, the transition from consumption to service will continue in 2019, and service consumption is expected to continue to maintain double-digit rapid growth. In recent years, with the Engel coefficient of urban residents falling below 30% (28.6% in 2017), the consumption structure of residents is shifting from commodities to services, and service consumption accounts for nearly 40% of the total terminal consumption. In 2019, with the opening up of the service industry, the service quality will continue to improve, and the transformation of consumption structure will continue. It is expected that consumption expenditures such as tourism, education, medical care and cultural entertainment will maintain a relatively rapid growth momentum.
3. In terms of external demand, the export situation is still grim, which will be a major negative pulling factor for the domestic economy. In terms of exports, in the short term, due to the uncertain prospect of trade war, the forced adjustment of global supply chain and the tightening of monetary policy in developed economies, the global economic growth momentum will continue to be weak in 2019, and the economic growth rates of the United States, Europe and Japan will all decline to varying degrees, and the volatility of emerging markets will increase and the growth momentum will slow down. The IMF has lowered its global economic growth forecast for 2019 by 0.2 percentage points to 3.7%, while emphasizing that the balance of global economic growth is declining. In addition, Sino-US trade friction tariff measures have now covered 250 billion US dollars of export commodities, and its lagging influence on China’s exports to the United States (the US market accounts for about 20% of China’s exports) will gradually emerge. Therefore, China will face a weak external demand in 2019.
In the medium and long term, at present, China’s exports account for about 13% of the global share, and the growth space is limited. Coupled with the rapid increase in domestic labor costs, China’s consumer goods and investment goods exports will be roughly equal to the growth rate of global trade in the future, and China’s economy is gradually bidding farewell to the era of export-led.
4. In terms of price, it is expected that the price trend will show the characteristics of "CPI going up and PPI going down", and the overall inflationary pressure is limited. The key logic behind it is that the economic growth rate will further slow down in 2019, and the output gap does not support a significant increase in inflation under the expectation of weaker aggregate demand.
In terms of CPI, it is expected that the annual growth rate of CPI will rise slightly to about 2.5% in 2019, driven by the upward trend of "pig cycle" and higher service prices. The possibility of exceeding 3.0% in individual months is not ruled out, but the overall situation is still in a moderate state, and the trend during the period will be "low before and then high". Among them, in the second half of 2019, the effect of swine fever epidemic on pork prices will be reflected, and inflation expectations may heat up again, and its possible constraints on macroeconomic policies are worthy of attention.
In terms of PPI, the cumulative growth rate of PPI may drop to 1.0% in 2019, as domestic capacity reduction and environmental protection and limited production are expected to be further reduced, and the increase in international oil prices will be significantly narrowed. Considering the reasons such as the change of the base number, it will show a trend of "low before and high after", and the possibility of negative growth in the first quarter will not be ruled out. However, in view of the fact that the acceleration of infrastructure construction will support the prices of basic industrial products such as steel and cement, it is still unlikely that the cumulative growth rate of PPI will return to negative growth throughout the year. Finally, considering that the terminal consumption demand is restricted, the transmission effect of PPI to CPI will not be obvious in 2019.
5. In terms of exchange rate, the depreciation pressure of RMB against the US dollar is less than that in 2018, but it is still in a state of range fluctuation, and the fluctuation range may be similar to that in 2018. Externally, the spread between China and the United States under the influence of monetary policy is an important factor affecting the exchange rate of RMB against the US dollar. The FOMC meeting of the Federal Reserve in December 2018 has made it clear that the pace of raising interest rates will slow down in 2019. As a result, the monetary policy of China and the United States will gradually end the differentiation trend in 2018 and turn into "loose" in the same direction, so the external pressure of RMB depreciation will be reduced. However, considering that the Fed has just finished raising interest rates, it will immediately become loose, and the People’s Bank of China has clearly released the signal of "marginal easing" since the second half of 2018, so the RMB exchange rate still fluctuates, depending on the interaction of monetary policies between the two countries.
Internally, the Central Economic Work Conference in December 2018 did not mention the exchange rate, which shows that the tolerance of RMB exchange rate flexibility at the policy level has increased, so the internal pressure of RMB depreciation has increased. However, the People’s Bank of China’s work meeting in the fourth quarter put forward that "the RMB exchange rate should be basically stable at a reasonable and balanced level, and a balance should be maintained among interest rates, exchange rates and international payments". This shows that the exchange rate is still the concern of monetary policy, so the People’s Bank of China will still moderately intervene in the foreign exchange market when necessary. Therefore, even if the RMB exchange rate fluctuates greatly in 2019, it will be a very short-term "diving" and will not become the norm.
(II) Macroeconomic policy recommendations for 2019
In 2019, China’s economic operation changed steadily, and there were worries, internal and external pressures did not decrease, and downside risks still existed. Therefore, the objective situation requires that the macro-policy in 2019 should follow the principle of "sizing up the situation, being cautious and moderate", focus on the main contradictions, give full play to the function of underpinning, further strengthen coordination and cooperation, and strive to achieve the optimal policy combination and maximum overall effect. At the same time, we must have the bottom line thinking, make unconventional policy plans and establish a forward-looking policy reserve.
At the same time, we must also see that the long-term positive development trend of China’s economy remains unchanged, and the tough battle against risks is still on the road. In this process, the macro-policy should give consideration to demand management and supply-side reform, and ensure the continuity and stability of the policy at the same time, so as to keep the economy running in a reasonable range for a long time.
1. Fiscal policy
First, a more active fiscal policy should achieve synergy. We should optimize the structure of fiscal revenue and expenditure. In terms of income, we should focus on enhancing the vitality of market micro-players, reducing the burden of private enterprises and small and micro enterprises, promoting the upgrading of manufacturing industry, improving per capita disposable income and expanding the domestic consumer market by implementing various tax reduction and fee reduction policies. In terms of expenditure, efforts will be made to improve the efficiency of the use of fiscal funds, reduce general expenditures, increase support for key areas, shortcomings and weak links, and prevent the growth rate of investment from continuing to decline.
The second is to coordinate the relationship between long-term and short-term goals. In terms of short-term tasks, fiscal policy should give priority to ensuring steady growth. It is expected that with the further increase in the issuance scale of local government special bonds in 2019, various financial funds will be accelerated in place, and attention should be paid to precise efforts and targeted use. For example, it can be more active in the fields of "complementing shortcomings and benefiting people’s livelihood" such as rural revitalization, agriculture, rural areas and micro-enterprises, new infrastructure, ecological protection and narrowing regional gaps. From the long-term goal, we must adhere to the development model that does not rely on excessive debt and excessive leverage. It is necessary to be alert to the excessive growth of local government debt, conduct regular surveys, and strengthen the collection of local government debt data. The issuance of special bonds must strictly correspond to stable and reliable repayment sources; It is necessary to establish a long-term mechanism to match financial supply with local economic development, and avoid the interweaving and spreading of financial and financial risks.
The third is to scientifically arrange the issuance of government bonds. At present, China’s government debt leverage is generally controllable, and the debt structure should be adjusted from three aspects: first, appropriately increase the issuance scale of national debt. The higher liquidity and pledge rate of national debt can improve the liquidity management level of financial institutions and form a better policy combination of steady growth with monetary policy. Secondly, strictly control the implicit debt of local governments and increase the scale of special debt issuance. While maintaining steady growth, we should take into account structural adjustment and risk prevention, and the improvement of debt transparency will help reduce the debt cost of local governments and realize a virtuous circle of debt. Finally, revitalize the stock of government bonds and expand the policy space. Support the innovation of government bond repurchase, bond lending and other transactions, and expand its scope of use as high-quality collateral; Continue to expand the investor base of local debt and improve the counter business; Moderately reduce the discount rate in policy operation and improve its efficiency in financial market.
2. Monetary policy
First, give full play to the role of the monetary policy toolbox. On the one hand, focus on making good use of traditional tools to ensure reasonable and sufficient liquidity, strengthen expected management and stabilize market sentiment. On the other hand, using new tools to realize "directional precision drip irrigation" can change the poor transmission of liquidity in structure and local areas, and reverse the tight credit spiral of economic downturn and financial procyclicality. Make good use of the existing toolbox and optimize the combination to maximize its effectiveness.
Second, the exchange rate management should adhere to steady progress. On the one hand, to continue to deepen the two-way opening-up of financial markets and the reform and opening-up in the foreign exchange field, exchange rate management should not only respect the prices determined by market supply and demand, but also encourage institutions to exercise self-discipline, not give up the regulation of other departments, and strengthen countercyclical adjustment to ensure that the foreign exchange market is "open and manageable". On the other hand, actively prevent and resolve the risk of cross-border capital flow, and improve the management framework of "macro-prudential+micro-supervision".
3. Financial policy
First, we should pay attention to both financial support and risk prevention. In 2019, the economy is still facing downward pressure, which requires that the intensity of financial supervision should be appropriate and the rhythm should be heavy, forming a good pattern of mutual support between financial stability and stable economic operation. On the one hand, we must ensure that financial support is accurate and efficient. In view of the private economy, it is necessary to strengthen the supervision of credit transmission, avoid the accumulation of funds in the financial system, continue to clean up unnecessary "channels" and "bridges", shorten the financing chain and reduce the financing cost. For local governments, financial institutions should be guided to provide funds for projects under construction and short-board investment through reasonable credit granting and subscription of special bonds. On the other hand, never relax the string of risk prevention. It is necessary to strengthen inspections and prevent financial institutions from illegally financing local governments. It is necessary to form a joint force in macro-policies, prudent policies, regulatory policies and market management, manage the financial order, and stabilize the expectations of capital and foreign exchange markets.
The second is to build an effective financial supervision system to achieve incentive compatibility. We should respect the law of market operation, and we should not simply use administrative orders to excessively intervene in the market, so as to avoid the opposite effect of policies. In particular, we should pay attention to distinguishing policy objectives from specific means to achieve them. For example, when guiding financial institutions to support private and small and micro enterprises, we can allow a certain credit risk premium and enhance their willingness to carry out small and micro credit; The interest income of micro-credit of financial institutions can be appropriately reduced.
1. After final verification and accounting, in 2017, the total current GDP was 82,075.4 billion yuan, a decrease of 636.7 billion yuan compared with the initial accounting; At constant prices, it increased by 6.8% compared with 2017 and decreased by 0.1 percentage point compared with the preliminary accounting.
2. Unless otherwise specified below, GDP growth rate and related data refer to actual growth rate.
3. In 2018, the pulling rate and contribution rate of the tertiary industry to GDP were 24.3 and 1.6 percentage points higher than those of the secondary industry, respectively.
4. Since July 5 and August 23, China and the United States have imposed 25% tariffs on $34 billion and $16 billion of imported goods in two batches; Since September 24th, the United States has imposed a 10% tariff on China’s $200 billion products exported to the United States.
5. Here refers to the volatility between the highest value of the central parity of the US dollar against RMB 6.967 (November 1st) and the lowest value of RMB 6.2764 (April 2nd).
6. Here refers to the cumulative value of national general public finance revenue from the beginning of the year to the current month/national general public finance budget for this year.
7. Including education, culture, sports and media, social security and employment, medical and health care and family planning, and housing security, which are directly related to people’s livelihood; And eight categories of expenditures closely related to people’s livelihood, such as science and technology, energy conservation and environmental protection, urban and rural communities, agriculture, forestry, water, transportation, commercial services, land and marine meteorology, and grain and oil reserves.
8. On August 14th, the Ministry of Finance issued the Opinions on Doing a Good Job in the Issuance of Special Bonds for Local Governments, which explicitly requested to speed up the issuance of special bonds, and took the end of October as the deadline for issuance in principle.
9. Increase the scope of MLF qualified collateral to AA+, AA credit bonds and loans for small and micro enterprises.
10. From the monetary policy implementation report of the People’s Bank of China in the first quarter of 2018.
11. According to the data of China Bond Information Network, as of the end of 2018, the yields of 5-year and 10-year government bonds decreased by 87bp and 65bp; respectively compared with the end of 2017; The yields of 5-year AAA and AA medium-and short-term notes decreased by 131bp and 83bp respectively compared with the end of 2017.
This article first appeared on WeChat WeChat official account: Bond Magazine. The content of the article belongs to the author’s personal opinion and does not represent Hexun.com’s position. Investors should operate accordingly, at their own risk.